Introduction
Real Estate industry globally is cyclical in nature and in India it is no different. The real estate cycle is tied to demand and supply of real estate and it is in turn closely tied to the cycles of construction activity and the economy in general. The dynamics of demand and supply of real estate are affected by couple of factors which accentuates its cyclical nature.
Speculators / investors: if we all bought real estate only for our own consumption i.e. only for the purpose of living, the real estate cycle would be much more smooth.
However, real estate is also an investment option to park our savings and arguably, it is a relatively safer option for preserving our capital. It does not require any understanding of the complicated world of investments. It is like gold something which is tangible and which we can touch and feel. This is especially true of India where we are enamoured by real estate and have always believed that the prices of real estate can never go down (not really true as we will see but most Indians continue to believe it nevertheless).
Then there are speculators who buy real estate just so they can sell it at a higher price. Of course not everyone can speculate in real estate since it involves a large initial investment.
Leverage: the second factor which gives rise to the boom bust cycles in real estate is credit – both to the real estate developers (supply side) and the buyers (demand side). The real estate bubble in the US economy in 2008 took leverage to an altogether new level. Artificial demand was stimulated through all kinds of dodgy loan practices which required the buyer to put little equity in their purchase, in the process creating an army of speculators. These loans were churned through securitization (CDO, ABS, CMBS, RMBS etc.). The lose loan practices created more demand and securitization created ever more supply for these loans. I will not go into the details here since we all know how that ended.
Understanding real estate cycles
The real estate cycle comprises of four stages and in general looks like this:
Figure 1
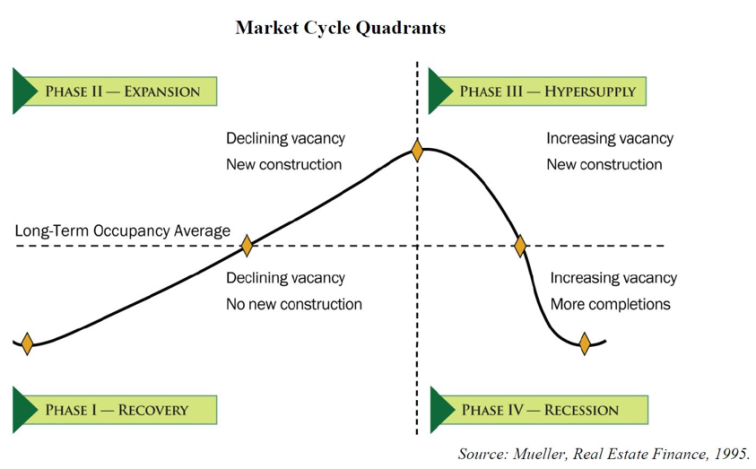
Let me spend some time on this figure since it requires a little explaining. In the above diagram, x-axis represents the long term occupancy average and the y-axis represents supply-demand mismatch. What is important to understand is that the above curve does not necessarily represent the house prices, which can continue to rise even during the hypersupply phase.
First, let us try to understand the four quadrants or phases of the real estate cycle.
Phase 1 starts when the demand for real estate is at its lowest point and gradually starts improving as the demand starts picking up. Since very little construction takes place during this phase the vacancy declines and prices start increasing gradually.
During phase 2, fresh construction starts at an increasing pace led by the increase in demand. However, demand outstrips supply and hence vacancy continues to rise along with the house prices. The continues increase in house prices leads to more demand which in turn leads to ever more supply.
Phase 3 starts when there is a slowdown in demand due to some external shock to the economy. However, the supply cannot be cutoff immediately as there is a lot of construction which is already in progress. At some point in phase 3, the prices will plateau due to the mismatch between supply and demand.
During phase 4, the demand continues to decline as more construction is completed and the vacancy continue to pile up. During the last stage of phase 4, there is doom and gloom all around as the price decline leads to less demand which further leads to lower prices.
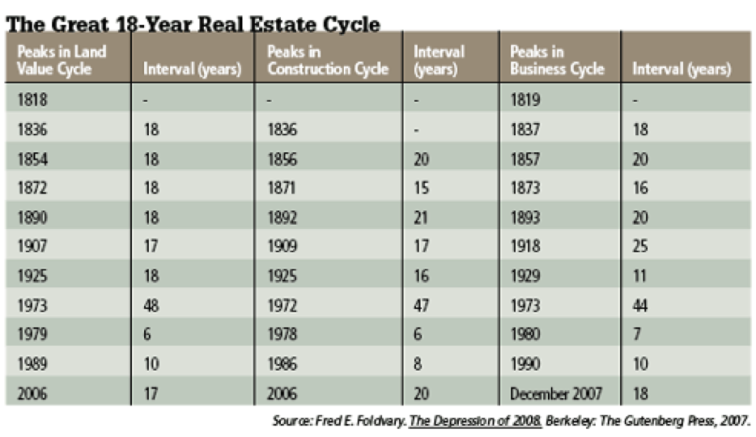
Of course the real estate cycle in real life is never as smooth and pleasing to the eye as the curve above. In reality, it is much more messy as there are multiple cycles within each of these four quadrants but broadly it follows the four phases as described above. In terms of the duration of the entire cycle, there has been much that has been researched and written. Research has shown that the total time period of the real estate cycle is 18 years i.e. the peak of the any two consecutive real estate cycles are separated by 18 years, across geographies both in the US and Europe. The table below shows the real estate cycles in the US. With the exception of world war 2, the peak of most real estate cycles are 18 years apart.
Figure 2
The case of real estate sector in India
With this background, let us examine the real estate cycles in India. India has seen one complete real estate cycle since the liberalization of the economy in 1991 and we are currently in the midst of the second real estate cycle. Below I present two different figures to demonstrate the first real estate cycle.
Figure 3 shows the trend of the property prices starting from 1991 to 2012. Figure 4 shows the decrease in prices in major cities during 1995-97 correction in real estate.
Figure 3
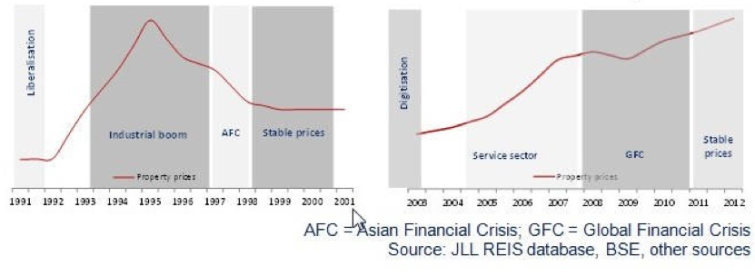
Figure 4
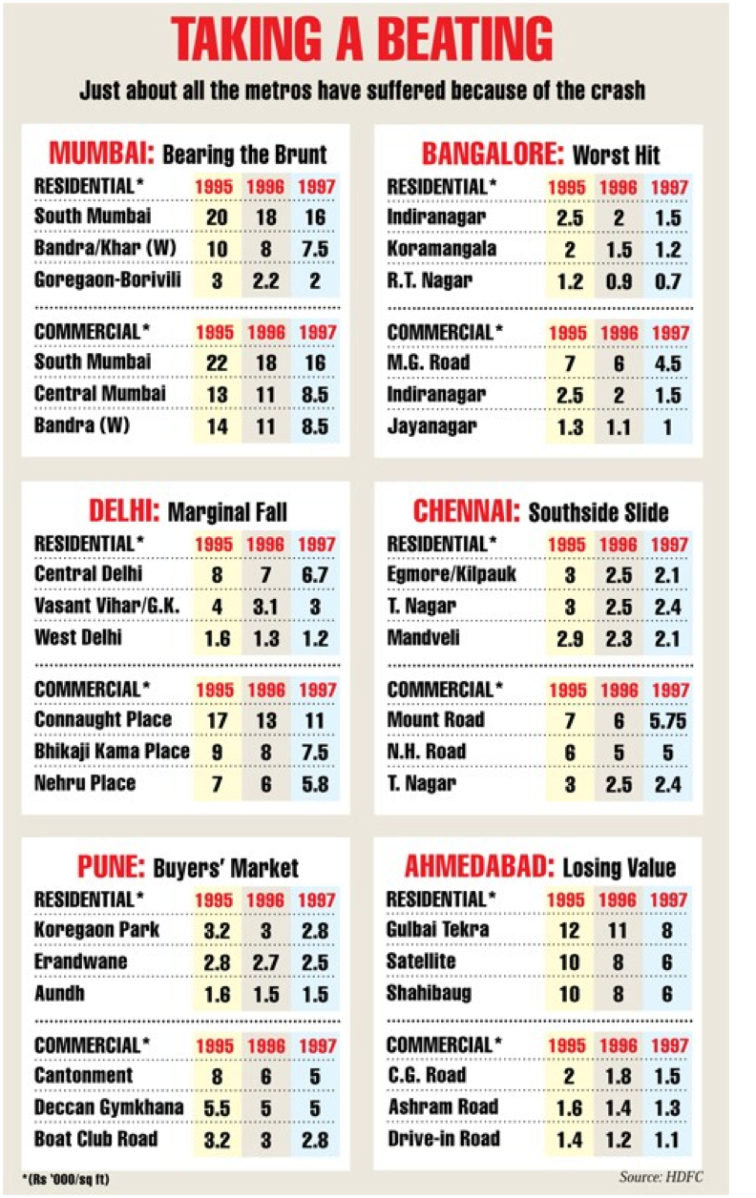
Source: Crash of 1997 – Indiatoday – 4 August 1997
As we can see very clearly from the above two figures, house prices peaked in 1995 during the first real estate cycle which started in 1991. Starting with 1995, the prices continued to decline till 2002/03.
In continuation of Figure 3, I present the data on house prices from 2007-2015 below.
Figure 5
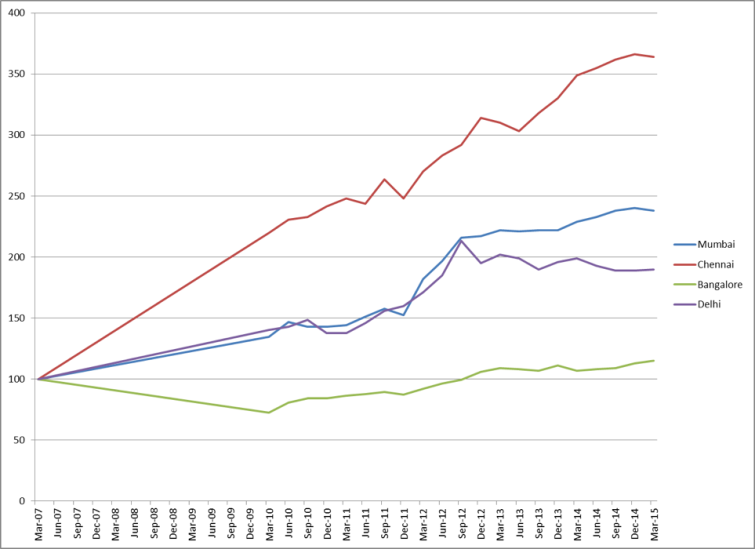
Source: Data from RBI and National Housing Board (NHB)
As we can see from this figure that prices in most of the cities continued to rise till late 2012. After that prices in Delhi declined and they have stagnated in Mumbai and Bangalore. Chennai is an exception and probably the only city where the prices have continued to rise.
While we have not seen an across the board correction, prices have been correcting in select areas. This is corroborated by figure 6 below:
Figure 6
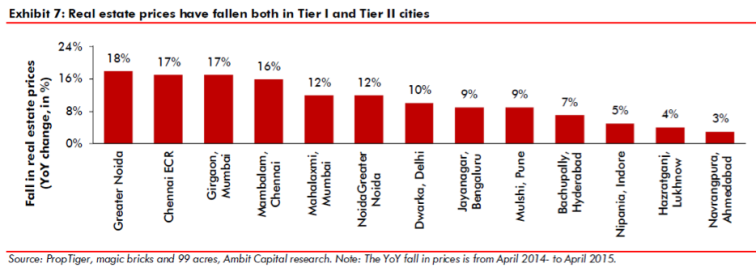
Source: Real Estate: The unwind and its side effects – Ambit – 14 July, 2015
So it is clear from the above two figures that house prices reached their peak in most cities in 2012-14 period which is 17-19 years from the previous peak of 1995!!!
The data speaks for itself – the 18 year real estate cycle it would seem applies to India as well. And if it does, we can expect the next peak in the house prices in 18 years from 2012 i.e. in 2030!!!
Of course all this is speculative and I would urge all of you to take this with a big spoon of salt. However, what is not speculative is the following: 1) Real estate prices are cyclical in nature. 2) The prices of real estate during the first real estate cycle peaked in 1995. 3) Currently we are in the late stages of the second real estate cycle.
What I want to do in the remainder of this article is to find out – 1) where we are currently in the real estate cycle and where are we headed? 2) Is it a good time to invest in real estate? 3) If yes, how should we invest to take advantage of this real estate cycle?
My submission (which I will try to explain in detail in the remainder of this article) is that Phase 3 – Hypersupply started somewhere around 2008 and we are currently near the end of Phase 4 – Recession. Since we are near the absolute bottom, it is a good time to invest in real estate. I will defer the answer to the third question for the second part of this article.
Now let us look at the data to support that assertion.
Phase 3: Hypersupply: 2008-13
As we have seen during phase 3, while the supply continues to increase on the back of the momentum gained during phase 2 but demand starts slowing down. The slowdown in demand is brought about due to an external shock to the economy. India underwent such a shock due to the subprime crisis of 2007-08. This demand slowdown in real estate sector is quite evident when we look at figure 7 below. It shows the sales and inventory of the 19 real estate firms listed on BSE500. The sales fell substantially during FY09 and FY10 and although it increased in FY11 but never reached the level of FY08. During this period the inventories continued to rise which means construction continued at a brisk pace.
Figure 7
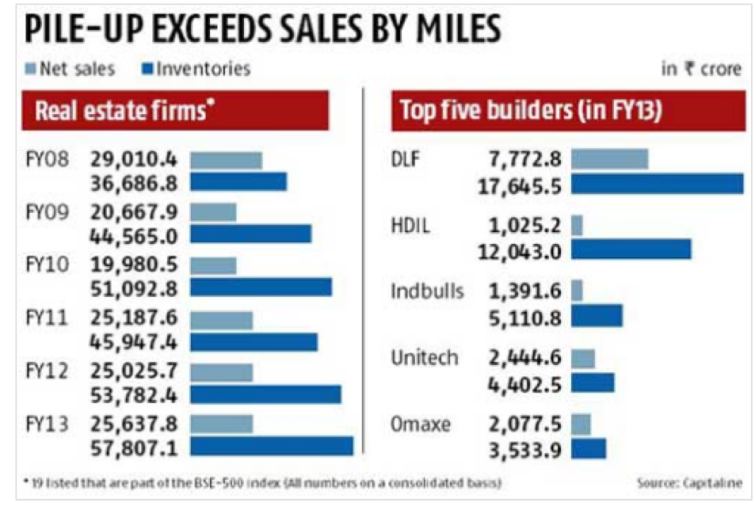
Source: Top builders sitting on Rs 58000 cr inventory – Business Standard – 23 September 2013
Phase 4: Recession – 2013-18(?)
The transition from hypersupply to recession happens when the supply shows clear signs of weakness and falls precipitously (after its continued increase during the previous phase). In the face of the slowdown in demand, at some stage we will start to see a decline in new project launches. This happened somewhere in 2013 for most of the cities except NCR region where it happened in 2014 as demonstrated by figure 8, which shows the stark decrease in the number of new property launches across cities. And that is when the real estate slowdown started in earnest.
Figure 8
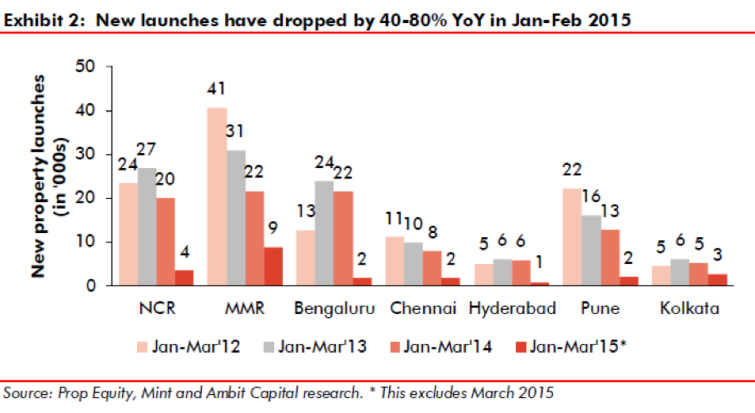
Source: Real Estate: The unwind and its side effects – Ambit – July 14, 2015
Another crucial metric which (as already discussed above) is instrumental in the real estate cycle is credit. Figure 8 shows the bank lending to commercial real estate and its trend from Nov 2009-15. The growth in bank credit as well has fallen to its lowest level in the past few years. With no end of the crisis in sight, bank credit growth to real estate sector fell to single digits in 2015 from double digits earlier.
Figure 9
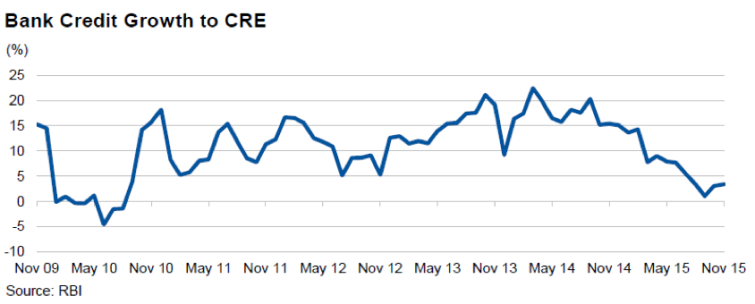
Source: FY17 Outlook, Real Estate Sector – India Ratings – 1 February 2016
Now that we have established that we are currently in phase 4 of the cycle, when do we get out of this phase and move to the next phase – which is phase 1 – recovery. For that to happen, we need to see a gradual pick-up in demand and bottoming out of the inventory.
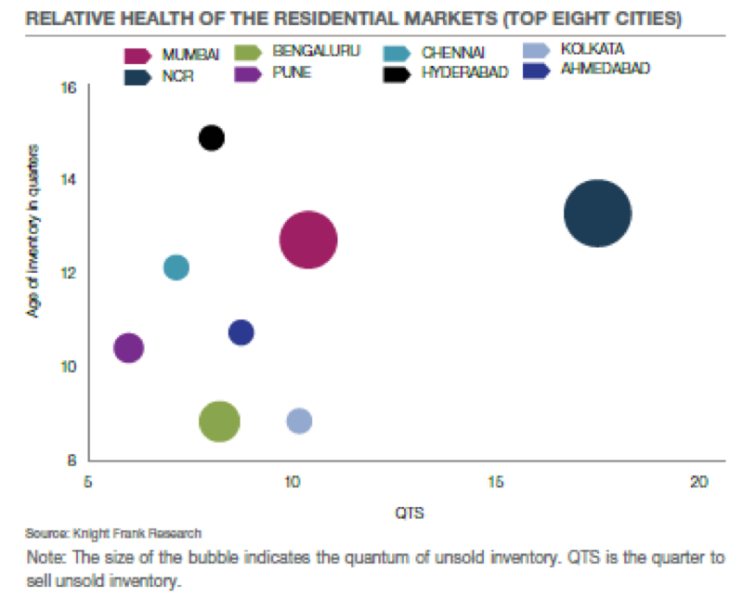
Let us look at the current demand and inventory situation. Figure 10 below shows the inventory and the average age of inventory for select Indian cities. The chart below shows the quarter to sell (QTS) on the x-axis and age of inventory in quarters on the y-axis. For example, Mumbai has a quarters to sell (QTS) of more than 10 times and age of its inventory is more than 12 quarters. For reference, QTS for a healthy real estate market is 4-6. As we can see from the chart below, the QTS for all the cities is more than that except for Pune. This is definitely not a pretty picture. However, there is some good news as well. The unsold units available in the market for the top 8 cities have reduced from by 7% from 710,340 in H12015 to 660,240 in H12016.
Figure 10
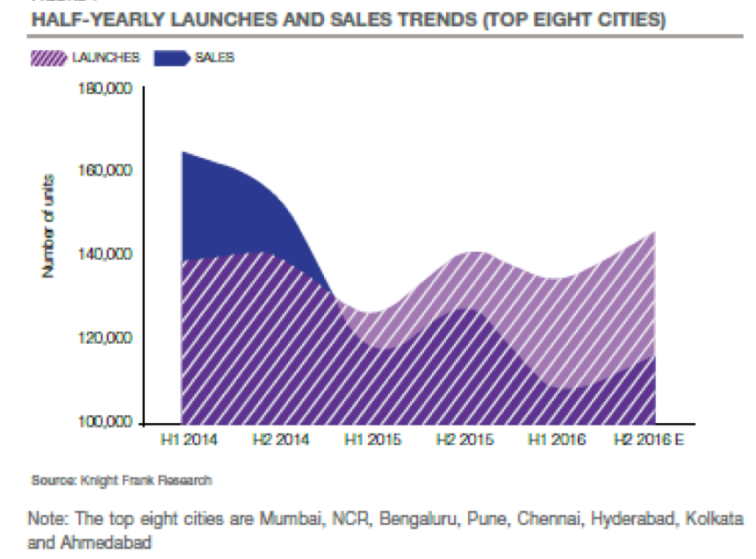
Now that we have some sense of the inventory, let us also get some idea of the current demand as well. The chart below demonstrates the half yearly trend of launches (supply) and sales (demand) for the top 8 cities. As is clear the demand as well as the supply are currently at their lowest level in H12016. However, they are set to improve from these levels in H22016 as predicted by Knight Frank.
Figure 11
But the signals for improvement at this stage are conflicting. Research by India Ratings suggests that demand is unlikely to improve at least till March 2017.
In addition, as we can see clearly from figure 10, the current health of the real estate market in different cities is very different. Clearly it will take a longer time for Delhi to come out of recession than say Bengaluru, which is better placed than the former on both the parameters – the time to sell the current inventory as well as the age of current inventory. Hence, we are clearly some time away from a broad based recovery across India. Experts seem to agree with this. According to Ambar Maheshwari, chief executive officer of private-equity funds at Indiabulls – “Home prices will languish in Mumbai for another couple of years even as we are seeing a pickup in sales. Another two years of volume growth will help absorb some of the unsold inventory and then we will see prices climb.”
As per him, – “prices in Delhi and its surrounding areas, referred to as the National Capital Region, may take up to three years to recover as the stock of unsold homes is huge.”[1]
How will the recovery look like?
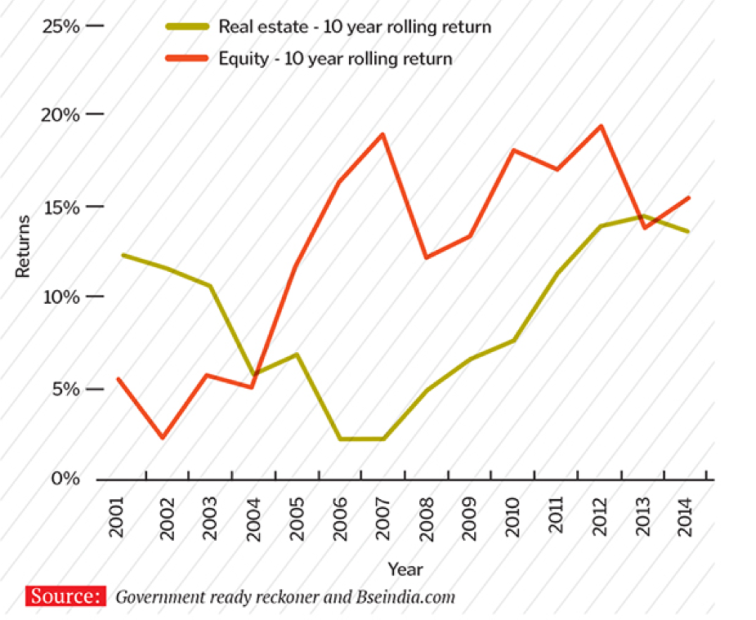
Taking cue from these experts and the data presented thus far, it appears that we are 2-3 years away from a recovery in the real estate sector. And after the prices have bottomed out, we can expect a long period of recovery. Given that is the case, isn’t it a good time to invest in the real estate sector? What are the kind of returns can investors expect in the upcoming recovery cycle? That is a little difficult to predict but let us take a cue from the last real estate cycle. Over the half cycle from bottom to the top, the returns from real estate during the last cycle was c. 15% annualized as we can see from Figure 12. As we can see from the figure, real estate prices reached their peak in 2013 at which time the annualized 10-year return (2003-13) was approx 15%.
Figure 12
Source: Return is king in real estate – Forbes – 28 January 2015
From 2008-2018 (phase 3 and phase 4), prices increased in Mumbai at a CAGR of 8%. The corresponding data for this period we have already seen in Figure 5.
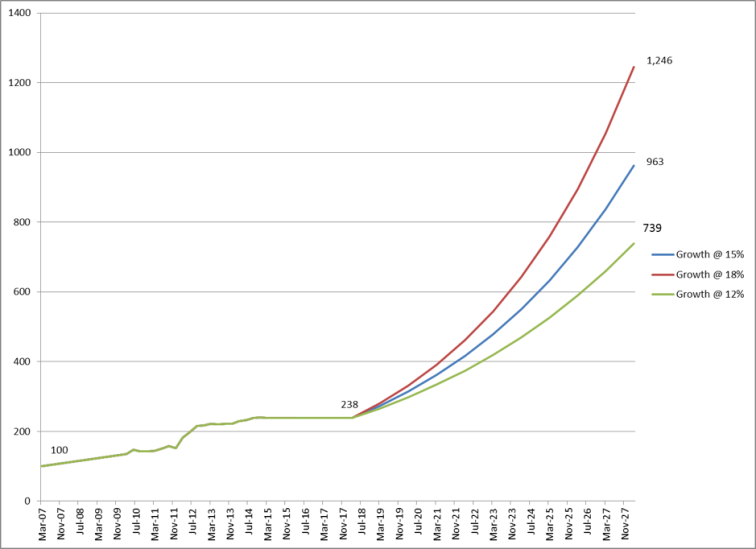
In the next figure, my attempt is to extend figure 5 into the future to try to get some sense of what the recovery will look like with help from whatever we have learn so far. We will work on the following assumptions:
- We can expect a recovery to start in 2-3 years from now. For the figure below I have assumed that the next phase (recovery) starts in 2018.
- Prices between now and the start of recovery will decline or stay stagnant. In figure 13, I have assumed the prices remain flat.
- The upcycle (including phase 1 and 2) should last till 2028-30. I have shown the prices till the year 2028.
- And finally CAGR for the housing prices has been assumed at 15%. I have also shown an optimistic (CAGR 18%) and pessimistic scenario (12%).
If house prices increase at a rate of 15% the price index will be 963 in 2028, which is 4.0x the current prices. For 12% and 18%, the levels will be 739 (3.1x) and 1,246 (5.2x) respectively.
Figure 13
Conclusion
We started by observing that real estate is a cyclical industry. The first cycle started with the liberalization of the Indian economy in 1991 and the complete cycle lasted till 2003-04. We are currently in the second real estate cycle and probably in the last stages of it. We estimated that it might take another 2-3 years (or maybe more) for this cycle to end and start of the next one. We are at the cusp of the start of a secular rally in real estate which will last for 10-12 years and will lead of price increase of 3-5 times during this period (based on the growth rate from the last cycle). Let me reiterate that the upward cycle will not be smooth like shown in figure 13 but composed of many smaller up and down cycles. However, evidence suggests that prices (net-net) will continue to move upwards during the first half cycle.
[1] Mumbai home prices recovery is two years away – Bloomberg – 1 August 2016

excellent write up!
LikeLiked by 1 person
thanks Hashim
LikeLike
Excellent Article Kashif. Found your profile on valuepickr. I hope you are the Kashif, whom I think you are.
I am heavily invested in a real estate developer called Anantraj Ltd. Surprising to see that you have not included Anantraj in this analysis.
LikeLike
actually i was referring to your analysis in the VP forum
LikeLike
Man how do you get your hands on all this data ??
LikeLike
Very good article to give/take some judgements for future growth of real state sector . I believe will start see some better data from 2019 year onwards . 2018 will be more or less consolidation or adjustable with pessimism that real state sector is picking up but may not be true actual data may be done the line 2019 to 2020.
LikeLike
Very good write up. Thank you for putting this together. It shows that you have done a lot of research. Kudos to you. Do you have an update for your investment thesis for Sunteck Realty? If so – I would like to learn your views at the current prices.
LikeLike
Thanks, glad you liked it. In Sunteck the only concern I had was I could never get comfortable with the promoters. Its not that I think the promoters are not good, its just that the information available to me is not enough to make a judgement. My philosophy now is quality of company first and valuation later (only if I’m convinced of quality). Hence, I have not looked at Sunteck as I’m not convinced on the quality of the promoters.
LikeLike
Very insightful… I wanted to know what will be the impact of Covid-19 on this Cycle?
LikeLike